 EN
EN 
DO UNIVERSITIES INVESTING IN TECHNOLOGY TRANSFER VIA PATENTING LOSE MONEY?
Abstract
INTRODUCTION
The Patent and Trademark Law Amendments Act (known as the Bayh-Dole Act) standardized U.S. federal policy to encourage university grant recipients to patent inventions in order to encourage commercialization of tax-funded research (1980). One result of the Bayh-Dole Act was an explosion of technology transfer offices (TTOs) to support the commercialization of research and development first in the U.S. and then throughout the rest of the world as there was early economic success from a handful of universities (Bertha, 1996; Siegel & Wright, 2007; Holgersson & Aaboen, 2019). Generally, TTOs focus on intellectual property (IP) protection including patenting (Chapple, et al.,2005; Rothaermel, et al. 2007), licensing and in some case spin-off companies (Siegel, et al., 2007). Bayh–Dole proponents argue that academic patent licensing has created $30 billion per year in the U.S. and created hundreds of thousands of new jobs (Pressman et al., 2017). Evidence for these claims is weak, however, as in general, research has found little impact from the Bayh-Dole Act for universities to actually increase technology commercialization (Henderson et al., 1998, Mowery et al., 2001, Mowery & Ziedonis, 2002). A constant stream of researchers critique the established view of IP being managed by universities (Sorensen & Chambers, 2008; Kenney & Patton, 2009; Greenbaum & Scott, 2010; Hall, et al., 2014; Kochenkova, et al., 2016; Holgersson & Aaboen, 2019) and even begun to reconsider the Bayh-Dole Act’s impact on invention at universities as a whole (Kenney & Patton, 2009). In addition, in a detailed review of the evidence Ouellette & Weires (2019) found many authors argued that Bayh–Dole costs simply outweigh the benefits (e.g. monopolistic inefficiencies (Granstrand, 1999) including raising the price of knowledge goods for both consumers and follow-on innovators (Pearce, 2012), many of whom already paid for the initial research through taxes. This bridges into the wider debate over whether intellectual property (IP) or ‘intellectual monopolies’ (Boldrin & Levine, 2002; 2005;2008;2009) of any kind are even a benefit to innovation (Takalo & Kanniainen, 2000) or the public good are far from complete (Pagano, 2014).
The question of benefits from pursuing IP at the individual university level should be far clearer. What if university decision makers only consider the economics from the university point of view? Graphs provided by the Association of University Technology Managers (AUTM) surveys show massive aggregate revenues form licensing IP growing year after year with but tiny nearly flat legal fees over decades (Ouellette & Weires, 2019). A non-critical look at these simple graphs makes it appear that there is a financial gain for the universities in pursuing IP. Thus, it is not surprising to observe the proliferation of TTOs throughout the world. The AUTM survey data on the costs to the universities for IP, however, is woefully incomplete as it only considers legal fees. It does not include litigation expenses or the technology and transfer office operating expenses (Ouellette & Weires, 2019). There have been some indications of the actual economics of IP protection, as the survey of AUTM members found that just under half brought in more revenue than their operating costs (Abrams et al., 2009). These analyses are obviously potentially embarrassing to technology transfer offices and are no longer provided in the latest surveys by their Association (AUTM, 2020). Even these surface analyses, however, were incomplete as they ignored other real costs to universities for patenting such as the opportunity costs for faculty to participate in the time-consuming patenting process.
This leads to an important question: Do investments by universities including their technology transfer offices for patenting intellectual property developed by the university provide a rate of return? To provide a concrete answer to that question and begin to gauge the impact of a more holistic costs of university patenting this study provides a new methodology for quantifying the investment of universities in IP. It then uses the novel methodology on a case study using real numbers from the average research university in the U.S. The results are discussed in the context of appropriate research policy for universities regardless of Bayh-Dole Act or similar national legislation in other countries.
METHODS
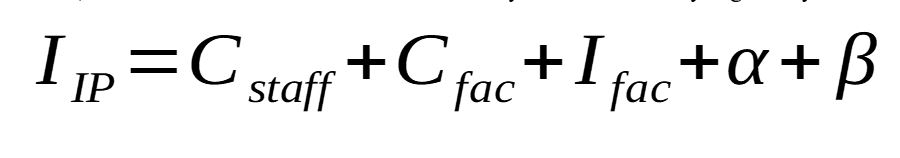
A university investment in IP is determined by four parts. First, there is the cost of legal fees excluding litigation, which has already been shown to be trivial (Ouellette & Weires, 2019). Second the cost of litigation, which is highly variable. On average, a university accrues $2 million in legal expenses (Merrill, Migliozzi & Decker, 2016). The final two costs, however have not been quantified previously, which include the direct investment in technology transfer office staff and their overhead as well as the direct costs of faculty time as well as their opportunity costs. These values can all be determined from publicly-available data.
To calculate the technology transfer office staff costs (Cstaff) equation (1) is used:
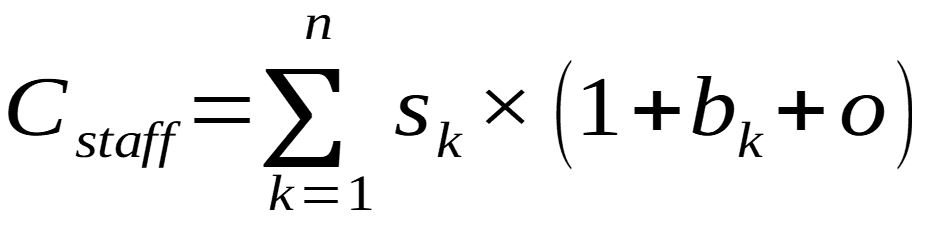
Where s is the salary of a IP-focused staff member k, n is the number of staff members in the technology transfer office, bk is the fringe benefits rate (%) for staff member k and o is the overhead rate, which is also referred to the facilities and administrative (F&A) cost (%). The staff can generally be found on the university’s public technology transfer website and for many publicly-funded universities their salaries, benefits and the university’s F&A rates are available. It should also be noted that the often-inflated values of the executive team’s salaries, which often oversee university IP were not included (Pearce, 2016a), again to be conservative.
Love (2014) points out that university patent programs reduce both the quantity and quality of university research by interfering with professors’ ability to obtain research funding, to collaborate and to disseminate their work. Quantifying all of these costs will be left for future work, however, here the first of these costs will be estimated. As a first approximation it is assumed that that IP related documents (DIP) that are public record including patent disclosures, nondisclosure agreements, patents and license agreements all took the equivalent amount of time for a professor to write as for a peer-reviewed article (DPR) each to produce. Similarly, it is assumed that the time to write an IP related document is equivalent to writing grant proposal.
The number of peer-reviewed articles for a given year for a particular university can be found from Google Scholar. Thus, as it is assumed that faculty research time in total is made up of generating documents for patents, papers and grants the percent of research time invested for all the faculty at a given university for generating IP (PIP) is given by:
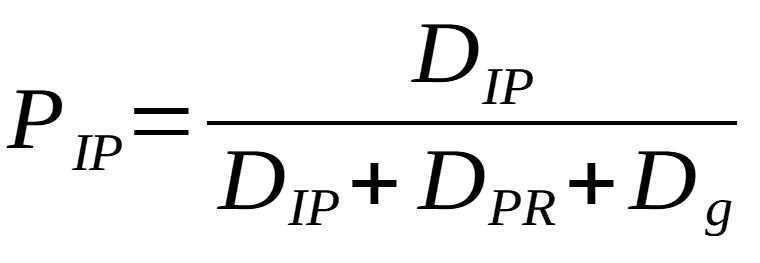
[%] (2)
This value can then be used to determine the direct costs and opportunity costs related to IP protection by expending faculty research time. The direct costs for this IP generating investment from faculty (Cfac) can be determined by:
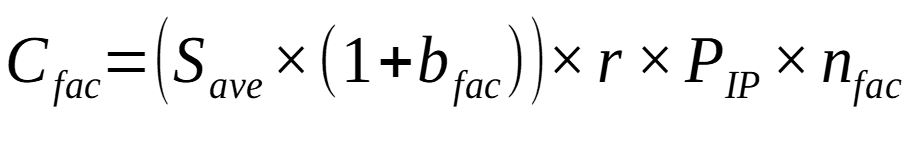
[USD] (3)
Where Save is the average faculty salary, bfac is the average faculty benefits (%) and r is the research percent of the total faculty working time (normally divided between teaching, research and outreach).
In addition to the direct cost (Ifac), there is an opportunity cost to faculty writing patents instead of grants given by the average grant value times the average success rate and the number of IP related documents:
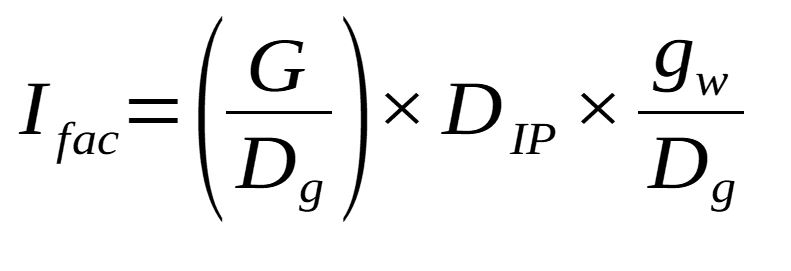
[USD] (4)
Where G is the total revenue in a year from grants in USD, gw is the number of grants won and Dg is the number of grants submitted. The number of grants submitted, won and the value can normally be obtained from the research office of a university.
Where Save is the average faculty salary, bfac is the average faculty benefits (%) and r is the research percent of the total faculty working time (normally divided between teaching, research and outreach).
In addition to the direct cost (Ifac), there is an opportunity cost to faculty writing patents instead of grants given by the average grant value times the average success rate and the number of IP related documents:
[USD] (5)
To be extremely conservative, these costs are often obscured by university administrators, and as some schools do not litigate around their IP, these legal costs will not be included in the representative case study here.
Finally, the direct economic benefits of university IP protection are given by:
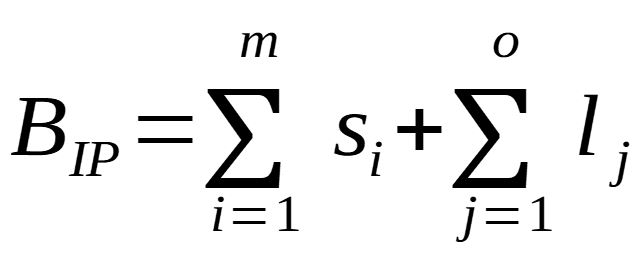
[USD] (6)
Where m is the total number of patents sold in a year, si is the value in USD for sales of patent i, o is the total number of licenses in a year and lj is the license income from j intellectual property. BIP can generally be found in university marketing documents as this is a positive value.
Thus, the return on investment (ROI) for IP at universities is:
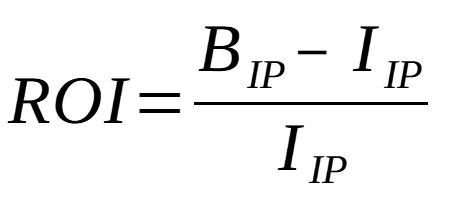
[%] (7)
CASE STUDY
Michigan Technological University (MTU) is a U.S. public research university founded in 1885. It was selected as it is about average for research expenditures for research universities in the U.S. as determined by the National Science Foundation (NSF, 2019). The performance of most research universities would be expected to be below it for IP income as would all non-research related universities.
The relevant staff were identified from the University’s research staff page (MTU, 2021a). The salaries of the identified staff were determined from the public posted annual salaries (MTU, 2021b). Note, to remain conservative again the secretarial staff were not included only the main IP-related staff. The research expenditures, IP-related income and costs were available from a Vice President of Research (VPR) Annual Report (Reed, 2020).
The values for the IP-related staff are summarized in Table 1 and all other input parameters are shown in Table 2 along with their sources. It should be noted that all data is for 2020 other than the grants received where 2019 was used to more realistically represent the income that generated the IP in 2020.
Table 1. IP-related staff and salaries (MTU, 2021b).
| Staff Needed for IP | Salary |
| Associate Vice President for Research Administration | $168,300 |
| Manager of Agreements and Operations, Innovation & Commercialization | $65,225 |
| Director of Technology Commercialization, Innovation & Commercialization | $79,549 |
| Director of Technology Business Incubation | $61,973 |
| Total (∑ sk) | $375,047 |
Table 2. Input data for MTU
| Variable | 2020 Values | Sources |
| Fringe rates faculty (bk,bfac) | 0.426 | (MTU, 2021c) |
| Overhead (o) | 0.546 | (MTU, 2021d) |
| IP output (DIP) | 164 | (Reed, 2020) |
| Disclosures Received | 25 | (Reed, 2020) |
| Nondisclosure Agreements | 97 | (Reed, 2020) |
| Patents Filed or Issued | 26 | (Reed, 2020) |
| License Agreements | 16 | (Reed, 2020) |
| Grants submitted 2019 (Dg) | 982 | (Reed, 2020) |
| Non IP output – DPR | 2,250 | (Google Scholar, 2022) |
| Average faculty salary (Save) | $96,243 | (UStats, 2021) |
| Percent of time on research (r) | 0.4 | Faculty performance review |
| Number of faculty (nfac) | 396 | (UStats, 2021) |
| Research Income (G) | $ 71,814,095 | (Reed, 2020) |
| Grants written 2019 (Dg) | 982 | (Reed, 2020) |
| Grants won 2020 (gw) | 609 | (Reed, 2020) |
| License income all sources (BIP) | $221,391 | (Reed, 2020) |
RESULTS
It is clear from a precursory evaluation of the input parameters that the economic gain from IP protection is dwarfed by the costs. The IP-related staff costs alone are more than 3 times what the case study university sees in IP-related income. A deeper look at the analysis shows that IP-economic performance is much worse than that because the staff costs are actually a smaller piece of the investment pie as the results of calculating equation 1, 3 and 4 show in Figure 1. Somewhat surprisingly, the direct cost of faculty investing their time in writing patents (blue area) is larger than the entire staff costs associated with intellectual property protection (green area). Perhaps even more striking is that the indirect costs of faculty time associated with IP chasing dwarf all the other costs. This is the opportunity cost lost when faculty invest time in patents. Thus, the yellow area in Figure 1 is the additional grant income the university would expect to receive if the faculty wrote grants instead of patents based on their current success rate. This value is more than 33 times the income realized through IP protection!
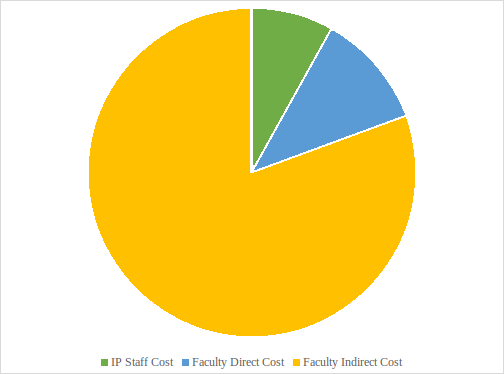
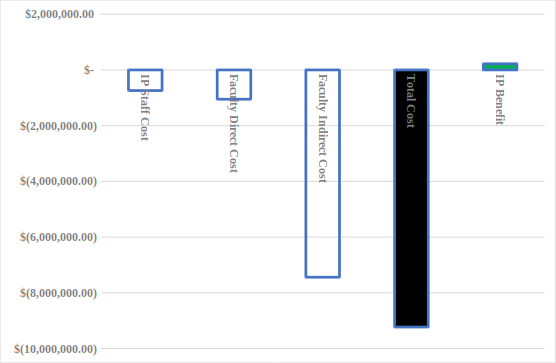
Figure 2. Investment costs and benefits for IP protection at case study university.
Figure 2 shows the total cost of IP investments (black box) compared to the IP-related economic benefits (green box). As can be seen in Figure 2, the case study university loses more than $9 million per year pursuing intellectual property. The ROI for this investment is -97.6%.
DISCUSSION
It is clear from the results of this case study that it is not rational for the case study university to invest in IP at all. It can be inferred that at least half of the U.S. universities are in the same situation, where the investment costs completely overrun any form of IP related income. This study adds to the volume of literature that questions the utility of the Bahr-Dohl Act. In addition, for the first time, this study showed how important the faculty costs (both direct and opportunity) are for making decisions about investing in IP. Future work is needed to apply the methods shown here to the top tier universities that demonstrate high patent-related incomes as well as universities throughout the globe that have emulated the IP-strategies championed in the U.S.
In addition, to the abysmal negative returns observed in the results here, there is also considerable evidence that even when universities do make some IP-related net income, very little of it is useful for actual technology transfer. For example, Love et al., found that only 11% of academic U.S. patent sales bear the hallmarks of technology transfer (e.g. purchased with the intent to commercialize) and the other purchases appear to have been either defensive acquisitions by operating technology companies or purchases by nonpracticing entities (e.g. patent trolls) (2020). Future work is needed to determine the cost to society for universities providing IP to patent trolls.
There is also evidence that the entire incentive structure underpinning Bayh-Doyle does not work. Although some studies had reported that higher inventor royalties lead to more university licensing income, Ouellette & Tutt (2020) found that the earlier results were driven by coding errors. In addition, they found “no compelling empirical evidence that increasing university inventors’ royalty share has a significant effect on any of the outcomes.” These results are supported by two recent interview studies, one in the U.S. (Pearce et al., 2022) and one in Canada (Pearce, et al., 2022b) that showed the vast majority of university researchers would support giving away all of their IP for access to an open source endowed chair. Given the results shown here that appears to be a rational decision based on economic grounds alone.
For all the concerns about the negative implications of universities acting like corporations (Washburn, 2008), universities have so far remained blinded to the fact that pursuing patents is generally a money losing proposition (Merrill, Migliozzi & Decker, 2016). Instead, VPR offices pretend that gaining IP rights is the success factor rather than generating revenue (like a business) or benefits to society (like a non-profit) (Kirchberger & Pohl, 2016). For example, using the case study university again, the annual reports proudly display the invention disclosures per $10 million of research expenditures (Michigan Tech. 2022), which compares favorably to other universities. This ratio, is meaningless, not only because of the tiny fraction of invention disclosures that result in patents and the even smaller number that result in any form of revenue, but generating invention disclosures has no inherent value. As these invention disclosures are not peer-reviewed, using them to track innovation is of little more substance than quantifying TikTok or Instagram posts. Interestingly, the same cognitive error appears to be occurring among university administrators that has millions of teenagers hoping to become rich by becoming influencers on social media platforms (Fietkiewicz, et al., 2018), while only a tiny fraction will ever have enough followers to earn a real salary (Scipioni, 2021). Similarly, although a few universities have seen income from IP, the vast majority do not (Merrill, Migliozzi & Decker, 2016; Abrams, et al., 2019), and as this study has shown are likely losing millions of dollars a year.
Abrams, et al., found that overall, universities spend only 0.59% of their research budgets, which exceed $50 billion annually, on converting research to IP (2009). The results of this study are in line with this even though the constituents of IP investing were different (here it was 0.3%) and it still does not make economic sense for universities to pursue IP. Abrams, et al., found that in the U.S. only 16% of universities kept enough of the income from IP they generated to cover their costs (2009). They did not, however, calculate the faculty direct and indirect costs as shown here, so their results were massively overly optimistic. Yet, despite these poor numbers even from optimistic estimates, gushing support of Baye-Doyl that was published in Science by Loise & Stevens actually arguing that these numbers “simply verifies the institutional mission of the research enterprise: getting science into the public’s hands.” (2010). They are literally arguing that is praise-worthy for universities to lose money creating money-losing locked-down intellectual property. This is unfounded and incorrect in light of the overwhelming evidence that proprietary IP is not necessary to commercialize innovations and ‘get it into the public’s hands’ (Key, 2017). A plethora of studies, demonstrated business models and current IP management practices in the private sector that endorse alternative to patenting, such as openly publishing new inventions and releasing inventions with free and open source licenses (Goth, 2005; Krishnamurthy, 2005; Bonaccorsi, et al., 2006; Henkel, 2006; Chang, et al., 2007; Munga, et al., 2009; Perr et al., 2010; Holgersson, et al., 2018; Ziegler, et al., 2014; Pearce, 2017; Franz & Pearce, 2022). Open source strategies are particularly well-positioned for publicly-funded research (Parth & David, 1994; Bogers, et al., 2018; David, 2003) and can provide strategic national policy objectives (Heikkinen, et al., 2020). Finally, Greenbaum & Scott (2010) point out that most TTOs “will never turn a profit, drain limited university resources and potentially hinder innovation and knowledge transfer” (p. 55). The results of this study further bolster this conclusion, but shows that universities have the opportunity to increase their research income by more than 10% (case study showed 12.7%) by cutting costs (eliminating all IP protection-related investments). It is clear that following the U.S. lead to lock down university IP is an economic mistake. Universities in other countries should carefully do full cost accounting on their own IP investments.
Instead of investing in IP, for both their bottom line and the good of society universities can open source all innovations developed. Even for open hardware, based on downloaded substitution value alone (Pearce, 2015), the funding of open source development generally provides a very high return on investment (Pearce, 2016b) as compared to the deeply negative returns found here. For example, free and open source scientific hardware represents an 87% savings over proprietary offerings per instrument (Pearce, 2020) and its development can be scaled through lateral distributed manufacturing (Dupont et al., 2021).
CONCLUSIONS
This study provided a new methodology for calculating the full costs of intellectual property protection at universities. The results of applying this methodology to an average research university in the U.S. showed that it is not economic to invest in IP protection and patents. As generally practiced in the U.S. now it is not economically rational to continue to support Technology Transfer Offices. Instead, to increase the economic bottom line of the university as well as increase the good that university research does for society universities can open source all their innovation.
Availability of data and material: Available upon Request
Funding: This study was supported by the Thompson Endowment.
Acknowledgments: None
Declarations of interest: none.
References:
Abrams,I. Leung, G. Stevens, A. J. How US academic licensing offices are tasked and motivated—Is it all about the money? Research Management Review 17 (2009). https://www.wpi.edu/sites/default/files/docs/Offices/Intellectual-Property/How_are_US_Academic_Licensing_Offices_Organized_Tasked_Financed_and_Motivated_–_Final.pdf
AUTM. AUTM 2020 Licensing Activity Survey. https://autm.net/AUTM/media/SurveyReportsPDF/FY20-US-Licensing-Survey-FNL.pdf
Bayh-Dole Act, Pub. L. No. 96-517, 94 Stat. 3019 (1980) (codified as amended at 35 U.S.C. §§ 200-211).
Bertha, S.L., 1996. Academic research: policies and practice. Journal of ethnopharmacology, 51(1-3), pp.59-73.
Bogers, M., Chesbrough, H. and Moedas, C., 2018. Open innovation: Research, practices, and policies. California management review, 60(2), pp.5-16.
Boldrin, M. and Levine, D., 2002. The case against intellectual property. American Economic Review, 92(2), pp.209-212.
Boldrin, M. and Levine, D.K., 2005. The economics of ideas and intellectual property. Proceedings of the National Academy of Sciences, 102(4), pp.1252-1256.
Boldrin, M. and Levine, D.K., 2008. Against intellectual monopoly.
Boldrin, M. and Levine, D.K., 2009. Does intellectual monopoly help innovation?. Review of Law & Economics, 5(3), pp.991-1024.
Bonaccorsi, A., Giannangeli, S. and Rossi, C., 2006. Entry strategies under competing standards: Hybrid business models in the open source software industry. Management science, 52(7), pp.1085-1098.
Chang, V., Mills, H. and Newhouse, S., 2007. From Open Source to long-term sustainability: Review of Business Models and Case studies. In Proceedings of the UK e-Science All Hands Meeting 2007. University of Edinburgh/University of Glasgow (acting through the NeSC).
Chapple, W., Lockett, A., Siegel, D. and Wright, M., 2005. Assessing the relative performance of UK university technology transfer offices: parametric and non-parametric evidence. Research Policy, 34(3), pp.369-384.
David, P.A., 2003. The economic logic of “open science” and the balance between private property rights and the public domain in scientific data and information: a primer. The role of the public domain in scientific and technical data and information, pp.19-34.
Dupont, L., Kasmi, F., Pearce, J.M. and Ortt, R., 2021. “ Do-It-Together”: Towards the Factories of the Future.
Fietkiewicz, K.J., Dorsch, I., Scheibe, K., Zimmer, F. and Stock, W.G., 2018, July. Dreaming of stardom and money: Micro-celebrities and influencers on live streaming services. In International Conference on Social Computing and Social Media (pp. 240-253). Springer, Cham.
Franz, J., Pearce, J.M. (2022). Making the Tools to Do It Together: Open-Source Compression Screw Manufacturing Case Study. Journal of Innovation Economics & Management (in press).
Google Scholar., 2022. https://scholar.google.com/scholar?q=%22michigan+technological+university%22&hl=en&as_sdt=0%2C5&authuser=1&as_ylo=2020&as_yhi=2020
Goth, G., 2005. Open source business models: ready for prime time. IEEE Software, 22(6), pp.98-100.
Granstrand, O., 1999. The economics and management of intellectual property. Books.
Greenbaum, D. and Scott, C., 2010. Hochschullehrerprivileg—A modern incarnation of the professor’s privilege to promote university to industry technology transfer. Science, Technology and Society, 15(1), pp.55-76.
Hall, J., Matos, S., Bachor, V. and Downey, R., 2014. Commercializing university research in diverse settings: moving beyond standardized intellectual property management. Research-Technology Management, 57(5), pp.26-34.
Henderson, R., Jaffe, A.B. and Trajtenberg, M., 1998. Universities as a source of commercial technology: a detailed analysis of university patenting, 1965–1988. Review of Economics and statistics, 80(1), pp.119-127.
Henkel, J., 2006. Selective revealing in open innovation processes: The case of embedded Linux. Research policy, 35(7), pp.953-969.
Heikkinen, I.T.S., Savin, H., Partanen, J., Seppälä, J. and Pearce, J.M., 2020. Towards national policy for open source hardware research: The case of Finland. Technological Forecasting and Social Change, 155, p.119986.
Holgersson, M., Granstrand, O. and Bogers, M., 2018. The evolution of intellectual property strategy in innovation ecosystems: Uncovering complementary and substitute appropriability regimes. Long Range Planning, 51(2), pp.303-319.
Holgersson, M. and Aaboen, L., 2019. A literature review of intellectual property management in technology transfer offices: From appropriation to utilization. Technology in Society, 59, p.101132.
Kenney, M. and Patton, D., 2009. Reconsidering the Bayh-Dole Act and the current university invention ownership model. Research Policy, 38(9), pp.1407-1422.
Key, S. (2017) In Today’s Market, Do Patents Even Matter? Forbes. https://www.forbes.com/sites/stephenkey/2017/11/13/in-todays-market-do-patents-even-matter/
Kirchberger, M.A. and Pohl, L., 2016. Technology commercialization: a literature review of success factors and antecedents across different contexts. The Journal of Technology Transfer, 41(5), pp.1077-1112.
Kochenkova, A., Grimaldi, R. and Munari, F., 2016. Public policy measures in support of knowledge transfer activities: a review of academic literature. The Journal of Technology Transfer, 41(3), pp.407-429.
Krishnamurthy, S., 2005. An analysis of open source business models.
Loise, V. and Stevens, A.J., 2010. The Bayh-Dole Act turns 30. Science translational medicine, 2(52), pp.52cm27-52cm27.
Love, B.J., 2013. Do university patents pay off-evidence from a survey of university inventors in computer science and electrical engineering. Yale JL & Tech., 16, p.285. https://openyls.law.yale.edu/bitstream/handle/20.500.13051/7793/Love_2_Revised.pdf?sequence=2&isAllowed=y
Love, B.J., Oliver, E. and Costa, M., 2020. US patent sales by universities and research institutes. In Research Handbook on Intellectual Property and Technology Transfer. Edward Elgar Publishing.
Merrill, D. Migliozzi, B. & Decker, S. 2016.Billions at Stake in University Patent Fights, Bloomberg.com. https://www.bloomberg.com/graphics/2016-university-patents/
Michigan Tech. 2022. 2020 Invention Disclosures Per $10 Million of Research Expenditures https://www.mtu.edu/research/about/stats-data/
Mowery, D.C., Nelson, R.R., Sampat, B.N. and Ziedonis, A.A., 2001. The growth of patenting and licensing by US universities: an assessment of the effects of the Bayh–Dole act of 1980. Research policy, 30(1), pp.99-119.
Mowery, D.C. and Ziedonis, A.A., 2002. Academic patent quality and quantity before and after the Bayh–Dole act in the United States. Research policy, 31(3), pp.399-418.
MTU (2021a) Research Staff https://www.mtu.edu/research/people-departments/staff/
MTU (2021b) Michigan Technological University Annual Salary of Faculty and Staff Postions. https://www.mtu.edu/hr/docs/salaries.pdf.
MTU, 2021d. https://www.mtu.edu/fso/reports/rates/pdfs/fy21-24-f-and-a-rates.pdf
MTU, 2021c. F&A Rates. Fringe rates https://www.mtu.edu/fso/reports/rates/pdfs/pred-fringe-rates-fy22.pdf
Munga, N., Fogwill, T. and Williams, Q., 2009, October. The adoption of open source software in business models: a Red Hat and IBM case study. In Proceedings of the 2009 Annual Research Conference of the South African Institute of Computer Scientists and Information Technologists (pp. 112-121).
National Science Foundation (2019) Rankings by total R&D expenditureshttps://ncsesdata.nsf.gov/profiles/site?method=rankingBySource&ds=HERD&o=y10&s=a
Ouellette, L.L. and Tutt, A., 2020. How do patent incentives affect university researchers?. International Review of Law and Economics, 61, p.105883.
Ouellette, L.L. and Weires, R., 2019. University patenting: Is private law serving public values?. Mich. St. L. Rev., p.1329.
Pagano, U., 2014. The crisis of intellectual monopoly capitalism. Cambridge Journal of Economics, 38(6), pp.1409-1429.
Partha, D. and David, P.A., 1994. Toward a new economics of science. Research policy, 23(5), pp.487-521.
Pearce, J.M., 2012. Make nanotechnology research open-source. Nature, 491(7425), pp.519-521.
Pearce, J.M., 2015. Quantifying the value of open source hardware development. Modern Economy, 6, pp.1-11.
Pearce, J., 2016a. Are you overpaying your academic executive team? A method for detecting unmerited academic executive compensation. Tertiary Education and Management, 22(3), pp.189-201.
Pearce, J.M., 2016b. Return on investment for open source scientific hardware development. Science and Public Policy, 43(2), pp.192-195.
Pearce, J.M., 2017. Emerging business models for open source hardware. Journal of Open Hardware, 1(1), p.2.
Pearce, J.M., 2020. Economic savings for scientific free and open source technology: A review. HardwareX, 8, p.e00139.
Pearce, J.M., Pascaris, A.S., Schelly, C., 2022a. Professors Want to Share: Preliminary Survey Results on Establishing Open Source Endowed Professorships. https://doi.org/10.21203/rs.3.rs-1098989/v1
Pearce,J.M. Shardul Tiwari, S., Pascaris, A.S., Schelly, C., 2022b. Canadian Professors’ Views on Establishing Open Source Endowed Professorships. To be published
Perr, J., Appleyard, M.M. and Patrick, P., 2010. Open for business: emerging business models in open source software. International Journal of Technology Management, 52(3/4), pp.432-456.
Pressman, L., Yuskavage, R. and Okubo, S., 2017. The economic contribution of university/nonprofit inventions in the United States: 1996-2015. Biotechnology Industry Organization. Retrieved from https://www. autm. net/AUTMMain/media/Partner-Events/Documents/Economic-_Contribution_University-Nonprofit_Inventions_US_1996-2015_BIO_AUTM. pdf, date, 18, p.2018.
Reed, D. 2020. https://www.mtu.edu/research/about/stats-data/docs/bot-2020-december.pdf
Rothaermel, F.T., Agung, S.D. and Jiang, L., 2007. University entrepreneurship: a taxonomy of the literature. Industrial and corporate change, 16(4), pp.691-791.
Scipioni, J., 2021. Here’s how many social media followers you need to make $100,000 [WWW Document]. CNBC. URL https://www.cnbc.com/2021/04/30/how-much-money-you-can-make-off-social-media-following-calculator.html (accessed 2.12.22).
Siegel, D.S. and Wright, M., 2007. Intellectual property: the assessment. Oxford Review of Economic Policy, 23(4), pp.529-540.
Siegel, D.S., Veugelers, R. and Wright, M., 2007. Technology transfer offices and commercialization of university intellectual property: performance and policy implications. Oxford review of economic policy, 23(4), pp.640-660.
Sorensen, J.A.T. and Chambers, D.A., 2008. Evaluating academic technology transfer performance by how well access to knowledge is facilitated––defining an access metric. The Journal of Technology Transfer, 33(5), pp.534-547.
Takalo, T. and Kanniainen, V., 2000. Do patents slow down technological progress?: Real options in research, patenting, and market introduction. International Journal of Industrial Organization, 18(7), pp.1105-1127.
Ustats. (2021) Michigan Technological University https://www.univstats.com/salary/michigan-technological-university/
Washburn, J., 2008. University, Inc.: The corporate corruption of higher education. Basic Books.
Ziegler, N., Gassmann, O. and Friesike, S., 2014. Why do firms give away their patents for free?. World Patent Information, 37, pp.19-25.
Joshua M. Pearce

Joshua M. Pearce is the John M. Thompson Chair in Information Technology and Innovation at the Thompson Centre for Engineering Leadership & Innovation and a Canadian Academy of Engineering Fellow. He holds appointments at Ivey Business School and the Department of Electrical & Computer Engineering at Western University in Canada. He runs the Free Appropriate Sustainability Technology research group. His research concentrates on using open source appropriate technology (OSAT) to find collaborative solutions to sustainability problems and reduce poverty. He is the author of the Open-Source Lab: How to Build Your Hardware and Reduce Research Costs, Create, Share, and Save Money Using Open-Source Projects, and To Catch the Sun, an open-source book of inspiring stories of communities coming together to harness their solar energy, and how you can do it too!